Tutorial — Dashboard: from zero to continuous monitoring
The long-form guide to the monitoring service. By the end you'll have a multi-user, multi-project exposure radar running on your own machine.
The mental model
The dashboard wraps the scanner in a service:
flowchart TB
    U[you / team] -->|browser| SPA[dashboard UI]
    SPA -->|REST /api/v1| S[service]
    S --> DB[(SQLite)]
    S -->|background tasks| SC[scanner engine]
    S -->|every 10s| SCHED[scheduler
fires scheduled scans]
You register projects, fill them with domains, and the service runs scans — manually or on a schedule — persisting every bucket and finding to the database. The UI reads from that database.
Step 0 — Start and bootstrap
Open http://127.0.0.1:8420. On an empty database the login screen offers CREATE ADMIN ACCOUNT — the first registered user is the admin:
- Click CREATE ADMIN ACCOUNT.
- Pick username + password → you're in as
admin.
Why the first user is special
With an empty users table, registration is open exactly once (bootstrap). After that, only an admin token can create more users. See the auth matrix.
Step 1 — Create your first project
Projects are the organizing unit — a client, a product, a bug-bounty scope.
- Go to PROJECTS.
- In the
+ NEW PROJECTform: name itprod-assets, description "public origins of prod". - Click the row to open the project.
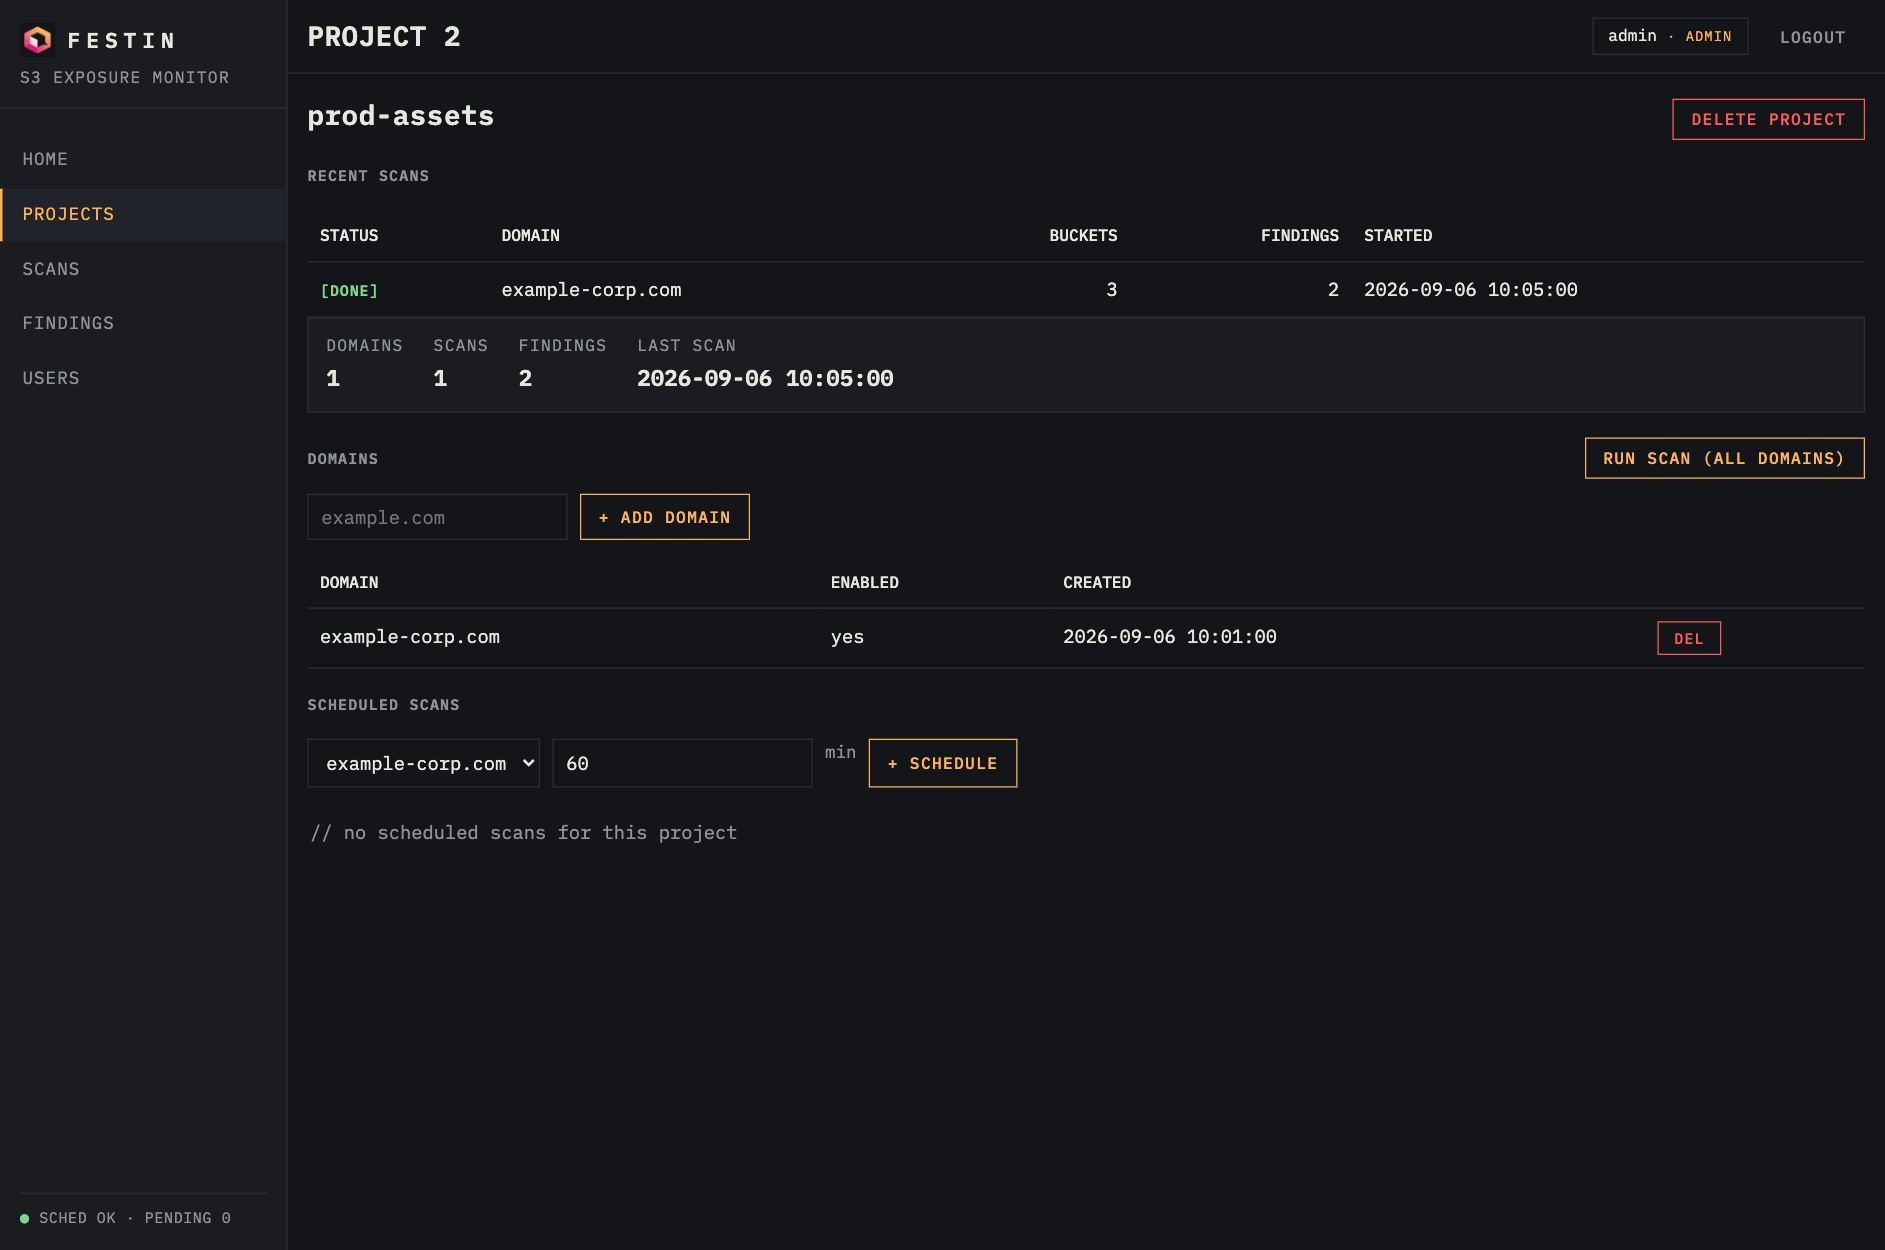
The project page shows counters (domains, scans, findings, last scan) that update as work happens.
Step 2 — Add domains
Inside the project, + ADD DOMAIN:
Add as many as you need. Each domain row can be deleted with the two-step DEL button (first click arms it → confirm? → click again within 3 s).
Step 3 — Run your first scan
RUN SCAN (ALL DOMAINS) queues a scan for every domain in the project.
- The scan row appears in RECENT SCANS as
[QUEUED]. - Within seconds it flips to
[RUNNING]. - On completion:
[DONE](or[FAIL]— the server log tells you why).
What happens under the hood
The service stores the scan record immediately, runs the scanner engine as an asyncio background task, and persists every bucket and finding as real database rows. The UI polls the scan until it reaches a terminal state.
Step 4 — Read the results
Click any scan row:
- Buckets — name + object count. This is your exposed surface.
- Findings — one row per secret: severity (
CRIT/HIGH/MED/LOW), detection rule, bucket, object, line, and a redacted match (AKIA****EXAMPLE— the API never returns full secrets).
Step 5 — Schedule continuous monitoring
Manual scans are so 2019. In the project page, SCHEDULED SCANS:
- Pick a domain from the dropdown.
- Set the interval in minutes (e.g.
60= hourly). - + SCHEDULE.
The scheduler loop ticks every 10 seconds inside the service; when a schedule is due, a scan fires automatically and its results show up like any other scan.
Restart behavior
The last-run tracker is in-memory. After a service restart, every schedule fires once on the first tick. Plan restarts with that in mind (or accept the extra scan).
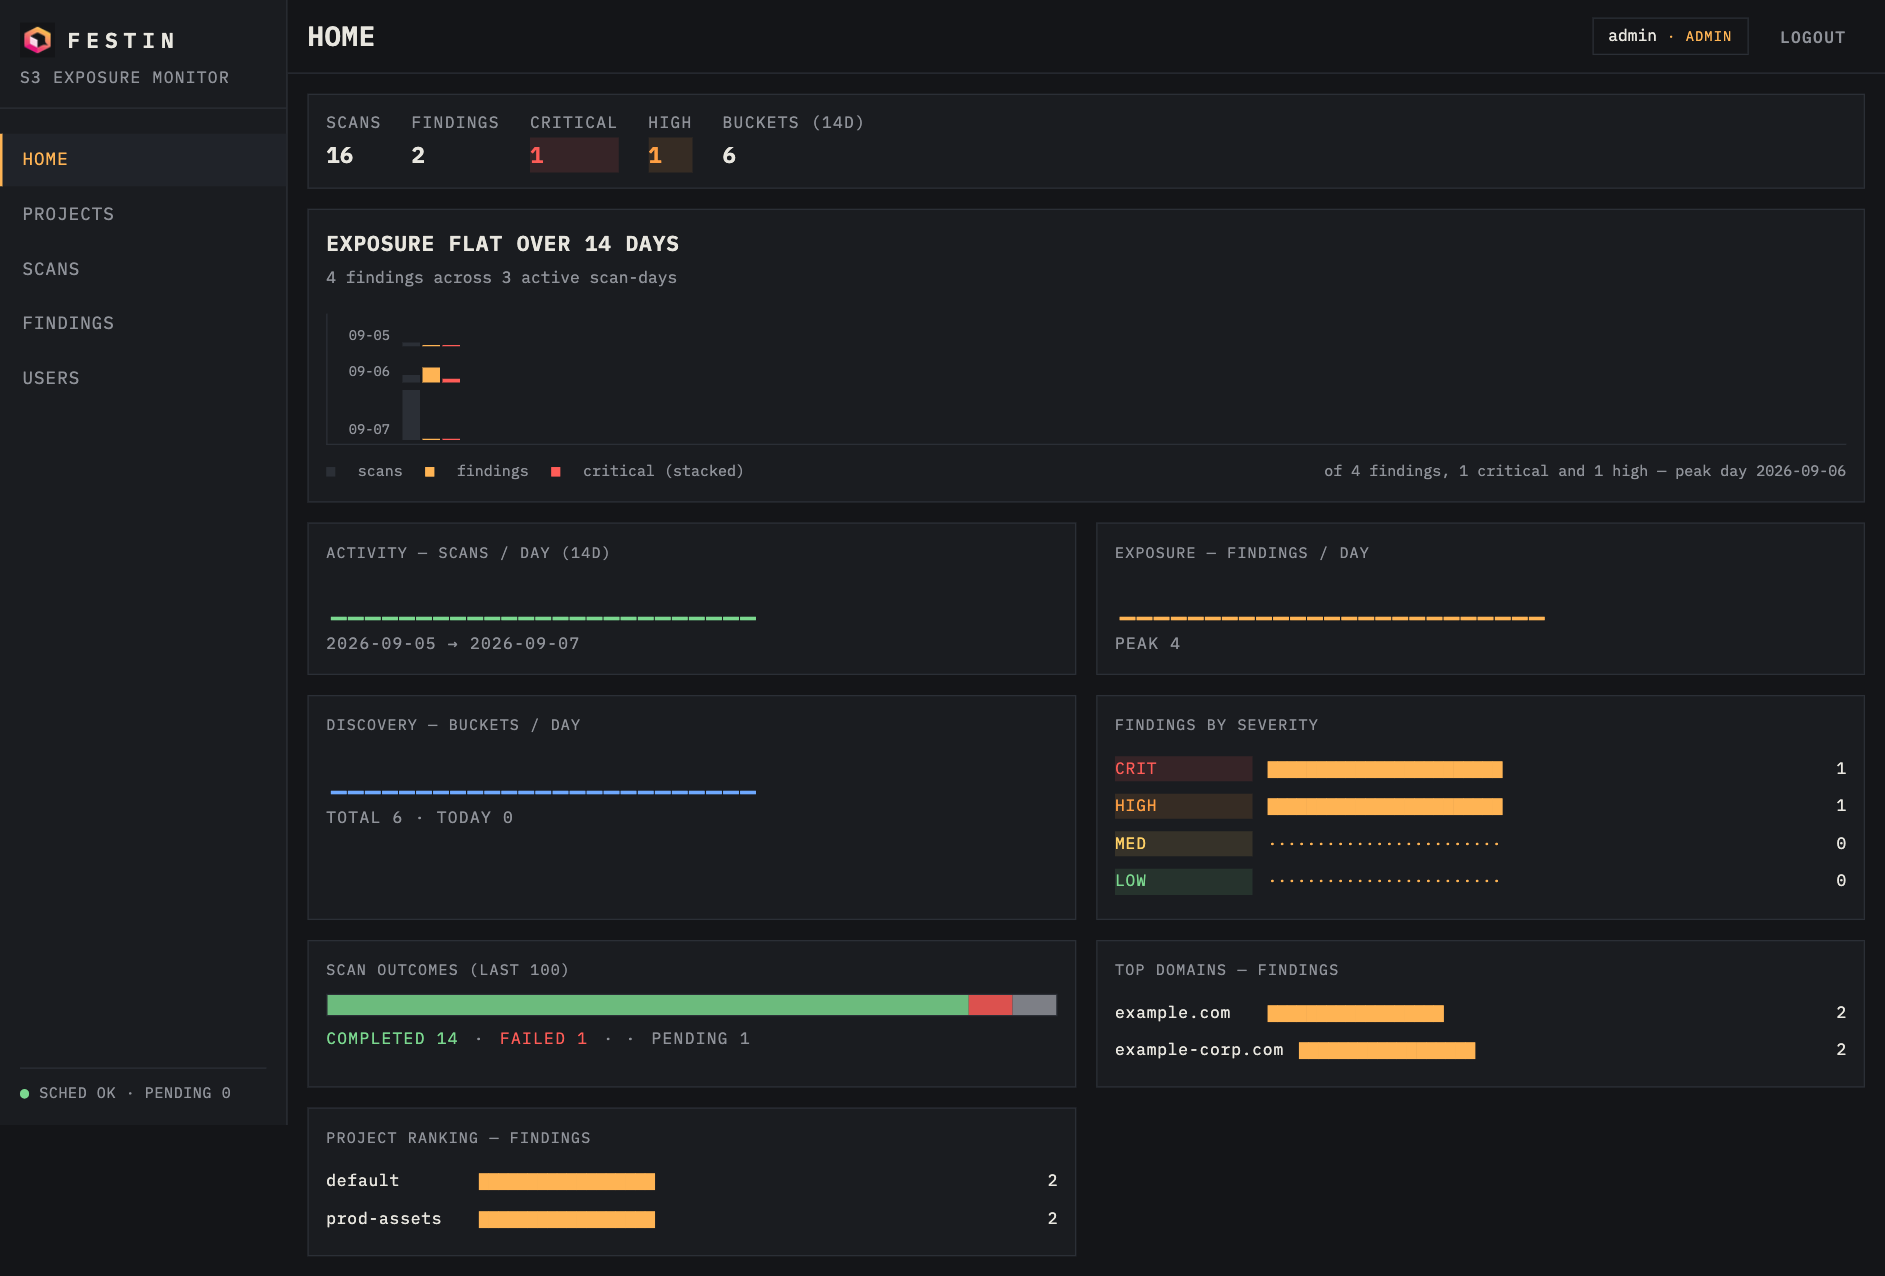
Step 6 — The HOME dashboard
After a few scans, the home view starts telling a story:
- Counter strip — totals at a glance: scans, findings, critical, high, buckets discovered in the last 14 days.
- EXPOSURE TREND (hero) — the headline chart. The title is generated from your data:
EXPOSURE TRENDING DOWN 40% SINCE 09-05,FLAT,UP… Below it, one group of bars per day: scans (grey), findings (amber), critical stacked in red. - Activity / Exposure / Discovery — 14-day sparklines.
- Findings by severity, Scan outcomes (last 100), Top domains, Project ranking.
Refresh happens automatically (15 s polling on list views; 4 s on a scan detail while it's still running).
Step 7 — Invite the team (users & roles)
Log in as admin → USERS:
- + CREATE USER — username, password, role (
vieweroradmin). - Flip a role with the inline select (instant
PATCH). DELremoves a user — never yourself, never the last admin (the UI knows, and so does the API).
What each role can do:
| Capability | Viewer | Admin |
|---|---|---|
| Browse projects/scans/findings |  | |
| Trigger scans | | |
| Manage projects/domains/schedules |  | |
| Manage users | | |
Step 8 — Organize by project
Real setups have more than one client or environment. Create them:
prod-assets— the public origins.research— bug-bounty targets.client-acme— contract work (findings are compartmentalized per project).
The SCANS view filters by project and status; FINDINGS filters by severity across everything. HOME ranks projects and domains by findings so the loudest problem surfaces first.
Step 9 — Wire it into your tooling
Everything the UI does is a REST call — automate it:
TOKEN=$(curl -s -X POST localhost:8420/api/v1/auth/login \
  -H 'Content-Type: application/json' \
  -d '{"username":"admin","password":"..."}' | jq -r .access_token)

curl -s -X POST localhost:8420/api/v1/scans/run-scan \
  -H "Authorization: Bearer $TOKEN" \
  -H 'Content-Type: application/json' \
  -d '{"domains": ["example.com"], "project_id": 2}'
Full reference: REST API.
Step 10 — Daily operation
- Check the pulse: the sidebar footer shows
● SCHED OK · PENDING N— amber dot when work is queued, red on errors. - Backups: SQLite file →
sqlite3 .backupwhile running. - Upgrades: stop, swap, start — migrations are idempotent.
- Token expiry: 60 minutes. When the UI says Session expired, log in again — that's by design (no refresh tokens).
Cheat sheet
| Task | Where |
|---|---|
| Create project | PROJECTS → + NEW PROJECT |
| Add domains | project page → + ADD DOMAIN |
| Scan everything in a project | project page → RUN SCAN (ALL DOMAINS) |
| Hourly rescans | project page → + SCHEDULE |
| Find the worst offender | HOME → Project ranking |
| Investigate a leak | SCANS → scan row → findings table |
| Invite a teammate | USERS → + CREATE USER (admin) |
When you're ready to make it someone else's problem too: deploy it.